
What is Aftcasting?
Luck is the second-most important factor for retirement planning; second only to withdrawal rate. Good luck can give you lifelong income, bad luck can deplete your portfolio very fast. It creates the perils of sequence of returns and sequence of inflation.
How can you visualize luck ? This is where aftcasting comes in.
Aftcasting
uses the actual market history, including growth rate and inflation, as they
exactly happened in history.
To help you with your planning, I have three tools for you: 1. My aftcast retirement calculator (ORC), 2. My book, "Unveiling the Retirement Myth", 3. My course "Advanced Retirement Income Planning
1. Otar Retirement Calculator (ORC):
There are two versions: Simple and Single Asset. Click here to order
Compare features of different versions.
Free trial copy: Click here to download. It has everything except the current age is fixed at 55.
2. Unveiling the Retirement Myth:
Order "Unveiling the Retirement Myth", my 525-page book about retirement income planning based on non-Gaussian philosophy, including numerous worked examples. Paperback version is sold out; only the pdf version is available to purchase. Discussion forum: Bogleheads. Comprehensive review by Steve Thorpe.
3. Advanced Retirement Income Planning:
This is a course I initially wrote in 2018. updated in 2020. Order the textbook only or take the course. The course, upon successfully completing the quiz, provides 8 hours of CE credits for Canadian CFP registrants.
My Philosophy:
While I agree whole-heartedly that the past performance does not necessarily indicate the future performance, designing a retirement plan that includes the black swan situations of the past, can prepare you better for a successful retirement.
Over the next ten years, over 80 million North Americans are hoping to retire.
We have successfully landed robots on Mars and observed their amazing findings. We have successfully discovered cures for diseases. We have found solutions to numerous problems.
Yet our financial planning community still does not have the tools to answer realistically some of the most basic questions:
Do I have enough money to retire?
How long will my money last?
When can I retire?
How much do I need to save for my retirement?
Do I need a life annuity?
What is my optimum asset mix?
The answers to these questions are one click away!
No More Guessing!
When we use a standard retirement calculator, we guess average future growth rates and inflation. We plug in these guesses together with some basic personal information into a retirement calculator. We push the "calculate" button and get a projection of our retirement finances.
Did
you know that in 80% to 90% of the time, these standard retirement plans will
fail?
Take for example, a retiree who has one million dollars in his investment portfolio at the beginning of his retirement. He takes out $60,000 annually, indexed to inflation. Assume his portfolio grows 8% and inflation is 3.5% per year.
In the chart below, the red line shows the outcome from a standard retirement calculator. It shows the portfolio value (the vertical scale) over time (the horizontal scale). At first glance, it appears wonderful; the portfolio seems to last longer than 30 years.
Now, calculate the portfolio value if this person were to start his retirement in any of the one-hundred years during the last century using actual market data and inflation. Assume a conservative asset mix - 60% fixed income and 40% equity. Each black line shows the portfolio value over time for retiring in a particular year since 1900.
Most portfolios expired well before the red line which is the projection of the standard retirement calculator.

No More Gambling!
I am not talking about taking your life savings to a casino in Las Vegas or Monte Carlo. What I am talking about is a mathematical model called Monte Carlo simulation. Some people use this model to forecast their retirement planning. While in theory it is based on probability of events, it does have several pitfalls:
The outcome of a Monte Carlo simulation is based on adding a degree of randomness to an average portfolio growth. You still have to guess an average growth rate for the rest of your life.
Markets are random in the short term, cyclical in the medium term, and trending in the long term. They are neither random, nor average, nor trending in all time frames. Secular trends can last as long as 20 years (up down or sideways). The randomness of the markets are piggybacked onto these secular trends. Assuming an average growth and adding randomness to it does not provide a good model for the market behavior over the long term and it makes the model to "forget" the black swan events.
The randomness in the Monte Carlo simulation is based on an assumed distribution curve of random outcomes. Some models use normal (Gaussian) distribution, some use log-normal distribution. In reality, several factors influence the shape of the distribution curve, such as: time spent in retirement, asset allocation strategy, asset mix, withdrawal rate, management costs, to name a few. Any randomness generated based on the incorrect distribution curve will result in significant variations from the reality of the markets.
When Monte Carlo model is applied to retirement planning, these factors introduce serious flaws.
Click to read my article on flaws of current Monte Carlo Simulators. Some of the most sophisticated (and very expensive) MC simulators may simulate the volatility of returns better than others. However, what kills a retirement portfolio is not the VOLATILITY of returns, but it is the SEQUENCE of returns. Click here to download the free MC2 simulator mentioned in the article which does a better job in simulating both volatility and sequence of returns. However, here is a better solution:
The Solution: Otar Retirement Calculator
I developed this model when I was writing my book "High Expectations and False Dreams - One Hundred Years of Market History Applied to Retirement Planning". My philosophy was very simple: Why guess? Why gamble? Why not use the actual, unadulterated historic market data?
Neither the standard retirement calculator, nor the Monte Carlo simulation can account for the Time Value of Fluctuations. The Otar Retirement Calculator does! The Otar Retirement Calculator is based on actual market data. There are no assumptions of average growth or inflation. It gives you a range of portfolio asset projections that enables you to plan realistically for your retirement. When you enter your personal financial data, the model calculates asset values and cash flow streams as if you retired in each of the years since 1900. The actual historic market data is applied to your specific financial situation. The results are summarized in this chart:
The table indicates the probability of portfolio depletion, as well as the outcome:
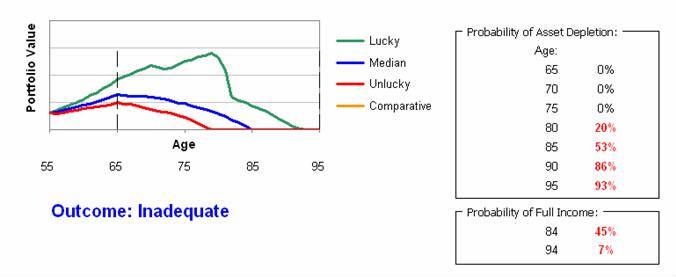
The green line shows the asset value of the top decile portfolio since 1900. That means only 10% of portfolios ever achieved or exceeded the asset values indicated by this green line. Do not use this for your retirement planning; it is there just to show you what can happen if you are lucky.
The blue line shows the asset value of the median of all portfolios since 1900. That means 50% of all portfolios had a lower value and 50% had a higher value than this line. And where it crosses the zero line (meaning no money left in the account), it means that half of the portfolios have already run out of money. Do not use the median for retirement planning because the odds are not on your side.
However, the median line may have one useful application for estate planning: When I am estimating the tax liability or the insurance needs at the time of death, then I use the median. In addition, I use the green and blue lines for best and worst case projections, respectively.
The red line shows the asset value of bottom decile portfolio value since 1900. It indicates the portfolio value where 90% of portfolios survived and 10% are depleted. This is the line you need to use for retirement planning. That is because at 90% survival rate, the odds are on your side. If this line does not touch the zero line until your age of death, then you have an good retirement plan
Income Carpet and Stress Test:
You can do a stress test on the income carpet and observe its effects:

Asset Classes:
The model works with four different asset classes:
Equity,
Nominal Bonds,
Inflation-Indexed Bonds,
Cash.
You can enter any percentage of each asset class (as long as the total is 100%) and see how this affects portfolio longevity.
In addition, your home and other property can be included in the retirement planning with options to downsize, sell, rent when necessary.
Equity Markets:
Since 1900: DJIA, S&P500, United Kingdom (FTSE-All Shares), Australia (All Ordinaries),
Since 1914: Japan (Nikkei 225)
Since 1919: Canada (SP/TSX)
Asset Allocation Optimizer and Scenario Analysis:
All you have to do is click on the "Optimize" button and seconds later, it is all in front of you. You don't have to drop names of Nobel Prize winners and explain mysterious concepts like "efficient frontier". This optimization process will tell you exactly what the optimum equity/fixed income asset mix should be based on actual market history and client's own cash flow picture: Lowest probability of depletion, longest portfolio life, largest residual amount of money in the portfolio. All by one click!

What you need to run the program?
The Otar Retirement Calculator is built on Microsoft Excel spreadsheet on a PC-type computer. You need Excel 2007 or newer to run it.
©
Copyright 2001-2024 Retirementoptimizer.com Inc. All Rights Reserved.
You may not modify, copy, reproduce, publish, upload, post, transmit,
distribute, or commercially exploit in any way any of this site content,
including code and software. Unauthorized redistribution or republication for
any purpose is strictly prohibited without the written permission of
Retirementoptimizer.com Inc.
Regulatory Declaration and Disclaimer:
The information provided here for educational purposes only. It is not intended to replace your broker, your financial planner, your tax advisor or any other professional that you currently retain, or potentially intend to hire in the future. There is no implication, expressed or otherwise, that any of my research and findings will be beneficial or helpful to your financial success. A prudent investor should read any information about investments with skepticism, including any information on these web pages. None of the information, research, comment, or anything in these web pages reflect the position, philosophy, or the investment techniques of the magazines I write for or of any other organizations that I associate with.