MULTI-ASSET VERSION: FREQUENTLY ASKED QUESTIONS
When I install the latest version, do I lose the earlier versions of the program? No. Each edition/version is standalone; when you download a different version/edition, it does not erase or overwrite another edition/version. If you download the same version, you will get a warning about overwriting existing files.
Can I load/run two different versions at the same time? No. You can only run one version at any given time.
I just installed the program. I tried to run it but I get an error message. Help!
Look at the bright side: Once installed correctly, you never have to deal with this issue anymore. However, until it works, there are several reasons why the program might not work. Here is a check list that might help:
Did you clear browser's cache before downloading?
Did you completely install the ORC? If not sure, uninstall and reinstall.
Is it installed on a PC type computer? (won't work on Apple)
Are you running MS-Excel 2007 (or newer)? (won't work with anything else)
Is the MS-Excel (MS-Office) "VBA enabled? If not, it will not work. See below how to fix that.
Did you add the program folder C:\ORC2024MA to trusted locations? See installation instructions.
Did you uncheck the AutoRecover?
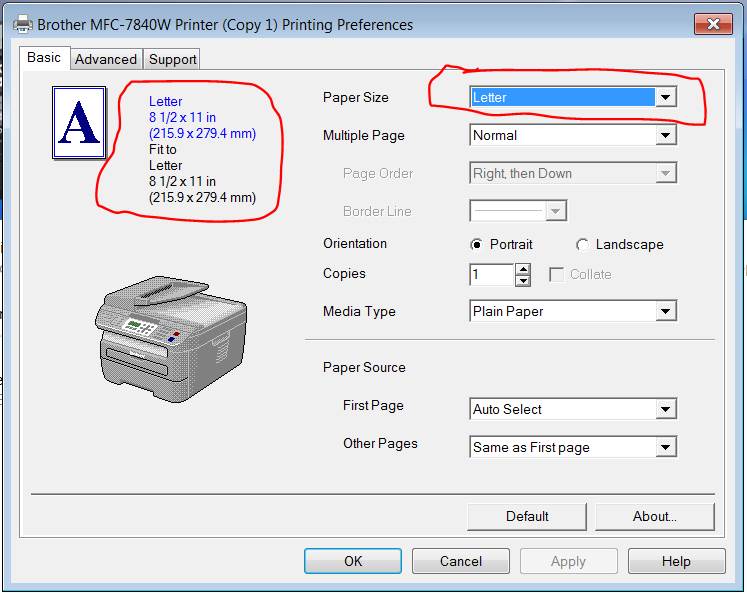
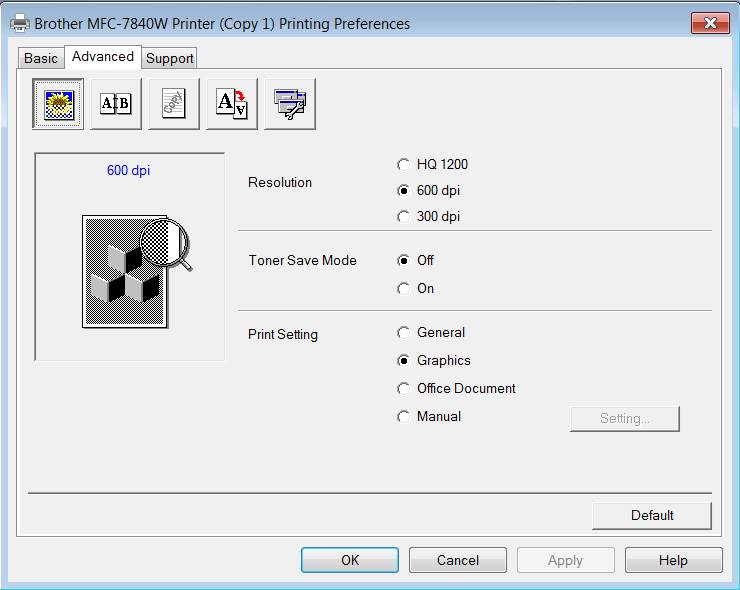
Do you have a designated printer? You don't need to have a printer, but you need to designate a default printer so that the program knows how to format/size pages.
I ran scenarios before. I got an error message!
Click on "End" on the error message box
Save your scenario if you want
Exit ORC completely, then restart ORC, retrieve your scenario. Make sure AutoRecover is unchecked.
Check your inputs and make sure all your inputs are in the correct format.
Run the scenario.
If you still get an error message, let me know.
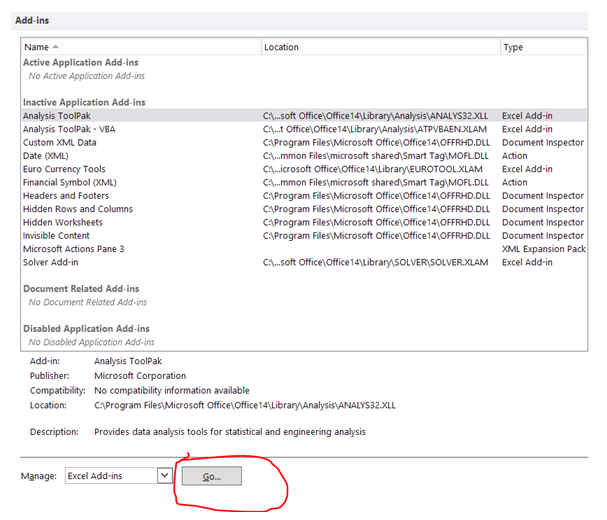
After running my scenarios, I try to close and exit Exit the program and I get an error message!
Did you add any Excel Add-ins recently?
Open the Excel with a blank spreadsheet
Click/ File /options/ Addins
How do I make sure my Office program is VBA enabled?
You might want to follow instructions here
Running
Windows 7 Professional. No such path
or folders "(Excel / File / Options / Trust Center / Trust Center Settings
/ Trusted Locations / Add new location) - cannot install. Advice?
"(Excel / File / Options / Trust Center / Trust Center
Settings / Trusted Locations / Add new location)" : This
is not a path. It is the sequence of the command buttons to add the location
C:\ORC2024MA to trusted locations list. Click on file in Excel, click on Options
button, click on Trust Center... and so on.
Where
is the default folder for the saved scenarios?
I would like to make a backup of these files but I can't locate the
folder.
The scenarios are saved in folder C:\ORC2024MA, in
file SavedScenarios.xlsx. Other defaults are saved in file VAData.xlsx. If you
are making a backup, you might as well backup the entire folder that way you
know for sure a data file goes is backed up the correct version.
Are you planning to move to web version? No.
Will your software run on Macintosh versions of Excel?
No.
Printing
Problem: No matter what I do, regardless of which color printer I use, I get
this strange printing on each page – can you help?
Punctuations: In some versions of Excel, punctuation marks can cause reference error ("#REF"). Try not to use them in any item descriptions (comma, double or single quotation marks etc).
How can I move the program from computer "A" to computer "B"?
Copy C:\ORC2024MA folder on
your computer "A" to a flash memory stick
Copy this folder from the flash
memory stick to computer
Make a shortcut to SAA4D file
on your desktop. You can assign the Str.ico file as the icon.
Start Excel, add C:\2024MA to
your trusted folders list
You are good to go.
How do I save a scenario?
Go to scenario name box on the Main page and type in
the scenario name:
Click on “Save this scenario" button
I entered a scenario earlier, saved it. When I retrieved it, the results of the outcome look ridiculous?
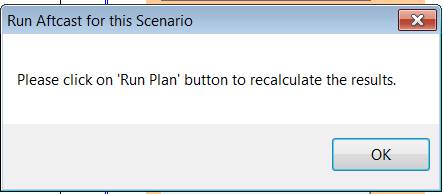
When you save a scenario, the results are not saved, only your input. When you retrieve a saved scenario or enter a new scenario from scratch, click on "Run Plan" button (on the "Main" page or "Assets" page). The ridiculous answers will be replaced with proper results.
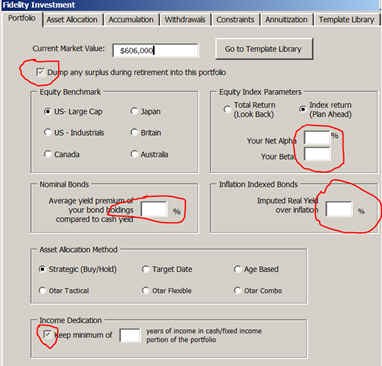
After
running the scenario, the optimum asset mix
has 0% equity, and the results don’t make sense at all. Can you tell me what
is wrong?
I checked
your input data. This unexpected result stems from missing input. You must fill
something into input boxes and grayed checkboxes and radio buttons.
For your
particular scenario, I circled all missing data in the following input sheets:
Before:
After:
Before:
After:

Before:
Before:
After:
It appears every time I open up a scenario it tells me the outlook is Excellent. But, when I do a RUN I will get back a Good or Adequate result. Save the scenario, and reopen, but the tool tells me Excellent. When I save a scenario is the last run result (Excellent, Good, etc) saved with it as well?
Same answer as above:
I
just ran the same exact scenario five (5) times.
Each result is different. What is going on?
1.
While
the scenario is running, do not touch the mouse or the touch pad.
Otherwise, the memory might be reset and you might get funny “results”.
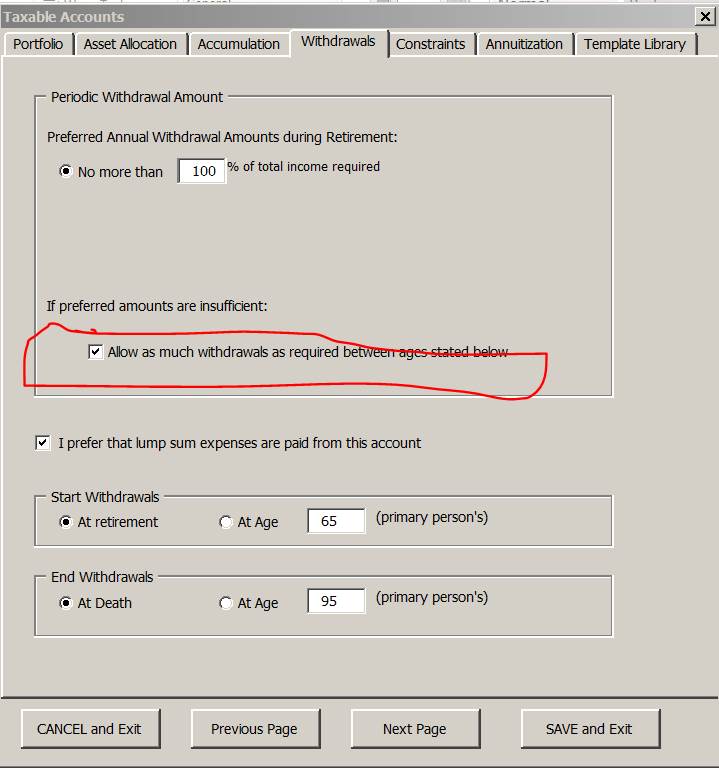
I
am having a problem that I don’t know how to fix. The problem is that
the model is reporting insufficient cash flow when there are plenty of assets
available to provide the income. Following are two screen prints
illustrating the problem. In this scenario, the client is 52. I am
adding $900,000 annually to their taxable account just to boost the account
balances, but still there is insufficient cash flow. Can you tell me what
I might be doing wrong?
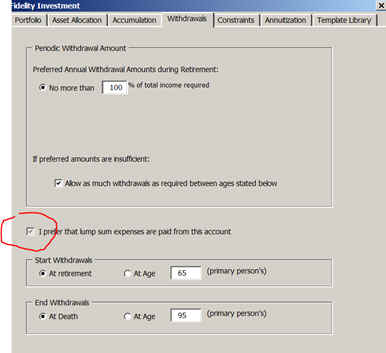
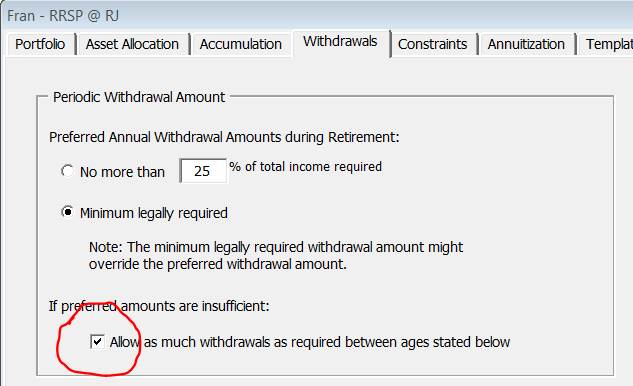
Check
the box “Allow as much withdrawals...” box for the asset named “taxable
accounts” under the withdrawals tab:
How can I make the scenarios run faster?
Don't enter FIA assets as purchased from an investment portfolio or bank assets because it will then run the FIA aftcast each time it runs the investment. Enter it as purchased with "external source" or "already have it".This way, it is calculated only once and set aside.
For investments, check the box to withdraw 100% of required income (instead of 25% or 50%)
Enter as "Withdrawals age start at retirement, end at death"
I usually run all my scenarios before the meeting with the client. Then all you need to do is report to and discuss with the client your findings. After that, you might want to run one agreed-upon case while you are talking to the client.
Do
I have to update yearly? Are there any ongoing charges?
Each year, I add another year's market data. If you are happy with 120 years
of market history, you don't need to update it. However, most users update for
the new features that I add each year.
Please
explain if I can use the program to estimate better my chances of not running
out of money from my asset allocation? Also, how different is your program from,
say, Sharpe's financial engines?
You may be confusing the benefits of asset allocation with the luck
factor. Luck factor is the largest component of the success of a retirement
portfolio. This factor alone determines whether or not you will run out of money
during retirement. Please read my article on my website about that. Asset
allocation is just icing on the cake and not the cake itself. Yes, in my
program, with the click of a single button, you can optimize the asset
allocation that gives you: The highest dollar amount in the portfolio, the
lowest probability of depletion or the longest portfolio life, or any
combination of these three. The program will clearly indicate the optimum point.
This optimum asset mix is not based on statistics, standard deviations or other
academic jargon, or data manipulation; it is based on actual market history,
applied directly to your own personal cash flow picture. As nice as this sounds
(others would sell to you this feature alone as "the best thing since
sliced bread"), optimizing the asset mix is just one of the tools in
retirement planning in my program. My program will give you the combination of
other tools, such as any combination of investments, life annuities, variable
pay annuities and variable annuities with guaranteed pay - all in one package.
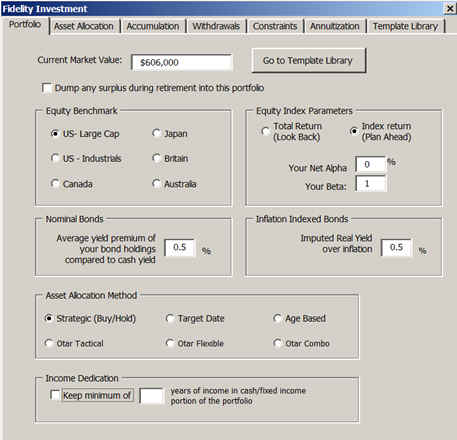
What
do you use as the fixed income return?
Nominal Bonds: The model takes the historic interest rate for 6-month
deposit and adds a premium. The current default is 1%, but it is user changeable
reflect the performance of your holdings. It reflects approximately
a fixed income portfolio with an average duration of 5 years, held to
maturity.
Inflation-indexed bonds: The model uses historic inflation plus a percentage as real rate of return. The current default is 1%, but it is user changeable to reflect the performance of your holdings.
What
difference does it make what my average MER is?
MER (Management Expense Ratio) is how much your mutual fund is charging you
to manage your money. It generally varies between 1% and 4%. All mutual funds
disclose this information. If you have a wrap account, add all costs, including
the WRAP fees and management fees to come up with a MER. If held for the long
term, MERs eat into your returns and shorten the portfolio life. Keep in
mind, there are several other factors, such as bad asset allocation, bad
investment selection, investor psychology to name a few, that can do a lot more
damage than MERs.
Why
do you ladder the life annuity?
Three reasons: 1. The older you are, the less money you need to buy an
annuity for the same periodic income, 2. The longer you delay buying the
annuity, the higher may be the estate value, 3. If you delay buying the annuity,
your investments may increase in value in the meantime.
Why
should I have annuities in my portfolio?
Just like we like to diversify our "investment portfolios" to
reduce the volatility risk, we need to diversify the source of our cash flows to
reduce the risk of running out of money. A life annuity usually pays a
higher periodic income than the sustainable withdrawal income from an
investment portfolio. By placing some of your assets in an annuity, you are
reducing "the withdrawal stress" from your portfolio, which likely
extents its life.
For
clients in 100% green zone, what allocation to equities and fixed income do you
use? I would thing 40% equity and 60% fixed to still be ok. Your
thoughts?
I’d still
use 40/60. I believe that the amount of risk one can tolerate should not change
with how much assets one can lose but how much assets one wants to keep.
What
is reverse-dollar-cost-averaging?
It is taking income from your investments on a periodic basis. You may have
heard of dollar-cost-averaging; investing periodically over time.
Dollar-cost-averaging reduces the average cost of your investments because it
takes advantage of price fluctuations.
The reverse-dollar-cost-averaging works against you. Because, once you sell part of your investment to provide you the periodic income, and if it is a bear market, then your losses are permanent. When the market comes back, you no longer have that part of your investment to participate in the rise.
My estimations show that whatever benefits dollar-cost averaging has through a bear market, the reverse- dollar-cost-averaging has about three times as much of a detriment to your portfolio for the same bear market. Therefore there are two things you have to be very careful of:
1. Always take your income from the least volatile investments, such as money market,
2. Do not rebalance more often than what is required for an optimum portfolio. For more info on this, read my award winning article.
If
I understand your software correctly, it gives us a representation of what might
of occurred if an investor had invested/withdrawn assets over a given period of
40 years, i.e. it starts at 1900 through 1940 and plots out the effect on
capital, then 1901 through 1941 , 1902 through 1942 etc. and gives us a sense of
how that portfolio performed during those historical periods through to the
present. How does it deal with recent periods, say 2000 to 2013, which is less
than the projected period?
The time period studied is the lesser of 40 years or -for retirement
years after 1973- it is the number of years up to and including 2013.
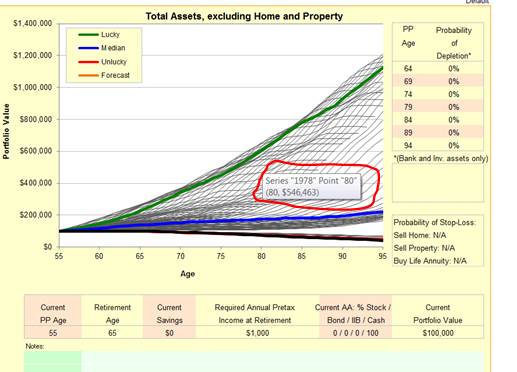
For example, if starting year is 2000, there are only 14 years of history
(Chart1). The table below the chart gives you all portfolio and cash flow
numbers for each year starting in 2000.
What happens after
2013? I don't know. No one does, we will have to wait and see next year.
Our intent is not necessarily to
"project" anything into the future; only to show the worst and the
best of any year during the last century. It
will take another 17 years to have a full 30-year history for someone retiring
in year 2000. At that point (in 2030) we shall all see how he would have fared.
However, in all likelihood, we will see the ruthless outcome of high tech crash
and credit crisis crash (and perhaps more to come) in about five years or so on
that person.
The success ratio (probability
of depletion) only includes completed history.
In the
User Guide states inflation is not a needed input. How does the calculator
handle the affects of inflation? Are historical inflation rates used each year
and the amount needed to be withdrawn is increased accordingly? I guess I am
asking in the “Tables" tab on the schedule that states how much is
withdrawn each year, how does the program decided how much to increase the
amount needed?
The program uses the historic inflation for each year since 1900.
Between 1900-1913, it uses the US Bureau of Labor Statistics wholesale price
index. After 1913, it uses the Consumer Price Index ( Note: The Consumer Price
Index did not exist prior to 1913). The program uses these for indexing the
periodic withdrawals/deposits for each age and for each year starting with the
current age and ending at the specified age of death.
In the Tables page, because of space limitations, we don't show these numbers (withdrawals/deposits, annuities etc) for each year of retirement / for each age / for each year since 1900. So, only the averages for each age are indicated in the "Tables" page.
However, in the Tables2 page, the CPI and the the dollar amounts for each starting year and each age are displayed.
I have been reading The Misbehavior of Markets by Benoit Mandelbrot and some of his premises and conclusions seem similar to the premises and conclusions underlying your Retirement Optimizer software. Would you say that your software is an application of Mandelbrot's multi-fractal model of market behavior (chaos theory)? Do you know if his mathematical model has been incorporated into any retirement planning software?
I don't remember seeing any retirement calculator based on chaos theory. Mine is based on actual market data (which can be chaotic at times!) and I don't intent to curve fit it to anyone's model. I am uncomfortable taking historic data and try to mould it into some statistical equation. I rather use the actual data.
How
and where do you take account of taxation of investments and incomes?
Taxation is another expense. There is no separate tax entry. You must
include all tax expenses as as a line item in the "Budget" page or in
"Total Periodic Income Required after Retirement" box on the
"Main" page.
I'm
planning to work on a case with one of my long distance clients. Will I be able to e-mail her pages out of the workbook as we
change scenarios. So far I haven't
had success trying this. Suggestions?
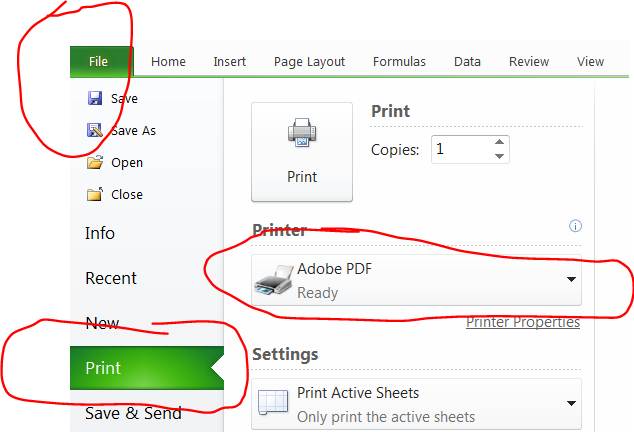
If you want to email pages
as a pdf file, then you need to have pdf file writer installed on your computer.
With that software installed, after you load the ORC, then set your default
printer as "pdf writer" (or something like that) then click on the
print entire worksheet button on the main page, and the entire workbook will be
saved as a pdf file. You can then send it to your client with your email. (Note:
Page formats are different, so it will print it into several separate files.)
I
load the program, but once I enter my figures, all of the probability of
depletions on the main page are 100%. Why?
In some language settings,
the decimal point in North American English way of writing is a comma. If this
applies to you, just set your numeric format to international.
The
lucky column on the optimization page changes depending on my inputs in the
asset mix column on main page. I am reading this table incorrectly?
The program may
choose a different age -than the age of death- to calculate these values. If it
has too many "zeros" at a specific age, then if will reduce the age
and then it will analyze the optimum at a younger age.
I
have a concern with how we are computing the MRDs so that the client has
adequate funding for living until 100. As an example I have a client with his
only asset is an IRA at $3.3 mil and needs $170,000 per year to live. This
$170,000 needs to be adjusted for inflation. How do we explain the higher
withdrawals and taxes? I think I know but would like to know your thoughts.
You just need to
enter tax expenses as another line item in your estimation of retirement
expenses. The program does not increase withdrawals to account for the increased
tax burden for the MRD. There
are two situations when MRD kicks in: 1. When the withdrawal rate is less than
the sustainable withdrawal rate and 2. When the retiree gets lucky and catches a
secular bullish trend throughout his retirement.
In your example, his withdrawal rate is over 5%, so the MRD will not kick in unless he is lucky.
Any excess money as a result of the MRD is added to another asset (to the asset with the blue description on the asset list).
The program shows the best, the worst and everything in between
during the last century. You cannot pick and choose the time frames to suit your
preferences. Allowing this may open the door to potential abuse of
selective-presentation to clients. If you want to know a performance in a
particular year, just go to the Chart1 page and move your mouse over the gray
lines.
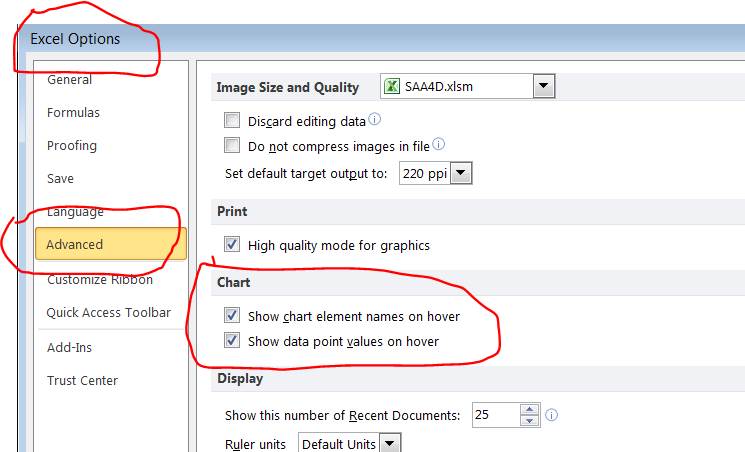
Make sure your Excel options enables this feature:
I
am a financial advisor in the U.S. - found your website and have been
devouring your articles. I am ready
to buy the retirement calculator but I'm wondering if you have an explanation
for the following:
On
one of the fund sites, they have a calculator that claims to be based on actual
market history dating back to 1926. Simply
choose one of three asset allocations (Conservative, Moderate, Aggressive) and
the length of retirement, and the calculator spits back a Withdrawal
Rate. The withdrawal rates for the "conservative" portfolio (35%
stocks) are slightly higher (but pretty close) to the sustainable withdrawal
rates that you suggest in your teachings. However,
in every case their rates are substantially higher as you go to portfolios that
are more aggressive. Yet, in your
teaching, you indicate that equities above 40% will actually decrease the
chances of portfolio survival. They claim: “In this calculator, we
create 81 different simulated "time paths" for the evolution of
your portfolio by first assuming that you begin taking withdrawals at a specific
point in history (e.g., 1926, 1927, 1928). We then use the actual, historical
rates of return that occurred in each subsequent year from that point forward,
applying them in sequence to your portfolio as time rolls forward. If such a
path needs to go beyond the year 2006, we just loop back to the returns of 1926
and cycle forward from there until either your assets are depleted or the end of
your planning horizon is reached. Given the past historical data we use (returns
from 1926 through 2006), we end up with 81 different starting years
with 81 different time paths. The monthly withdrawal amount shown by the
tool is the highest level of spending in which 85% of these historical
paths would have left you with a positive balance at the end of your
chosen investment horizon.”
What
is the flaw in such a calculator? The
typical person who uses this is going to insist on a portfolio of 65% equities
and think they can withdraw 5.25%.
As
you suspected, statistically and mathematically, I believe that this
model is flawed. The loopback assumes that after 2006, we will experience
another secular bullish trend of 1926, meaning that the cyclical bullish trend
that started after the year 2000 crash (which is similar to the 1933-1937
cyclical bull market) will continue another three years (the loopback years of
1926-1929). Is it probable? Never in history a secular bull market lasted
over 20 years, and this flawed loopback simply makes the secular bull markets of
1982 to 1999 to turn into an unusually long secular trend of 1982 to 2010,
i.e. 28 years.
Next: Probability
of depletion used: It appears that they are using 15% probability of
depletion (POD). This is too high. I limit the POD at 10%. Using the actual
historic data, I find that once you cross over the 10% POD, then
irreversible events can happen. There is a big difference in the ability of
salvaging a portfolio to create a lifelong income, when one uses a probability
of depletion of 15% instead of 10%, if you are retired already.
However,
market risk only one of the three risks in retirement planning:
1.
Market risk : which is the probability of portfolio depletion by the age of
death. As stated above, 10% is my limit.
2.
Longevity Risk : which is the percentage of surviving clients at a given age: My
limit is 10%. Which means generally , use age 95 as age of death
3.
Inflation Risk - the withdrawals not keeping up with inflation. My limit is 10%,
i.e. the purchasing power must go below 85% of the requested amount in any
of the portfolios that are subject to rules one and two. (i.e. even if the
criteria for the market risk and longevity risks are met as per stated
thresholds in #1, and #2, the loss of purchasing power must not exceed 10%. This
becomes important when we talk about variable annuities or EIA.
Long Term Care: Under the
costs section - I am putting the expected annual additional cost of one person.
Say $30,000. However, under Additional
protection, I think both need to be covered and so should I put in combined cost
protection, effectively doubling the expense? Also, this will calculate the
risk/reward if one suffers a LTC disability but does not cover the costs for
two. Does it make sense to double up
on both costs and additional protection to get a correct risk protection?
That
is always a tricky topic. The answer depends on if they own a home or not.
If
they own their home:
The
most expensive event is one person needs LTC care in a facility while the other
person is still living in their home. So, you have the expenses of the home
(same or almost the same) plus the expenses of the LTC facility
If
they live in a rental unit: Here, the
most expensive event is still one person needs LTC care in a facility while the
other person is still living at their (rental) home. If
both are in need of LTC, then they would just move in to the LTC facility. They
no longer have the rental expenses but a lot larger expenses of the LTC
facility.
You
need to run two separate scenarios and see how each case works -Case 1: one
spouse moves to LTC facility, and Case #2: both spouses move to LTC
facility.
I am
expecting that the values in the "Worst Case" values column in the
Tables page would equal the values on the "Total Assets" row of
Tables2 page for every year. However, in the cases I am running, in some years
the values in the "Worst Case" values in the Tables page are less than
the Total Assets in Tables2 page (the values are identical after about 10 yrs).
What could explain these differences?
The "worst" total assets in Tables2 is for the specific year that has the shortest portfolio life. The “worst” in the Tables page is a hypothetical case that looks at each age and finds the worst year for that age, irrespective of which starting year it is. So the difference is, the worst year has better years in some years (Tables2) than the worst of all years (Tables) . In theory, the total asset value of these "worst" years can be different for each age except the age at which all assets deplete. In practice, the first ten years or so might be different and then they converge, the limiting factor being the half-life of the typical duration of a secular trend.
How or what do I do to place my information of the cover sheet? I seem to be getting along with the data pages, but that has me confused. Bob Smith keeps showing up?
On the "Cover" page, in the green areas, just enter whatever you like to enter.
Then fill
in the “Bob Smith” area ("Additional Advisor Type and Info").
Then
click on “Fill this info on the cover sheet” button.
Then save
it as your template (using the button “save this as my template )
How do I change my page header information for the printouts?
To change page headings:
1.
1.
Go to the Main page
2.
2.
Click on “Your Page-Heading Info” button (below the “import
scenario” button)
3.
3.
Enter data as required and save
4.
Print the main page. If the printout comes out garbled then the
info entered is too long (or the default printer is not set), go to step 2 and
enter a shorter heading.
Printing
Problem: No matter what I do, regardless of which color printer I use, I get
this strange printing on each page – can you help?
If this does not work, (if you have any saved scenarios in the scenario file: then backup the scenario file C:\ORC2024MA\SavedScenarios.xlsx first), reinstall the program
When we
"optimize" a portfolio, the spreadsheet shows values and allocations
at age 75. We are not clear why that age appears and is apparently unchangeable?
Also, when we "optimize" a portfolio, we have input a certain initial
allocation (for example 85% equity, 10% FI, 5% IIB). Does the new optimum
allocation start then at age 75, or has that been reset to the very beginning or
the calculations?
When optimizing, the program looks for an age as close to the age of
death as possible. If you entered age 95 as age of death, the program will start
there to optimize.
However, if there is no money left in the portfolio at age 95, then there is nothing there to optimize. Then the program will decrease the optimization age in 5-year steps until it finds some numbers it can work with. It is not something that can be changed by the user; behind the scenes, it is a complex linear-programming process at work.
If you start with a way-off asset mix and then run the optimization, the optimum asset mix will show a wide range. Move the slider to inside the green area and click on the optimize button a second time to make sure that is remains inside the green band.
The optimum asset mix always starts at the current age, not some time in the future. For calculation purposes, it is constant for life, in theory anyways. But in practice, the optimum asset mix will likely change because of changing financial circumstances of the retiree, or after extreme market events that deviate from the market events that occurred last century. You should run the optimization at each annual review.
I was playing with the asset optimization feature. I was testing portfolios with zero distributions from 100% equity. The time frame was 25 years.
The graph was just not right. It was showing 32%-58% equity, even though I had 2% for the alpha in the look ahead mode and had input 100% equity under the asset.
1. Make sure to click on the "Optimize" button after selecting the the asset you want to optimize the asset mix for:
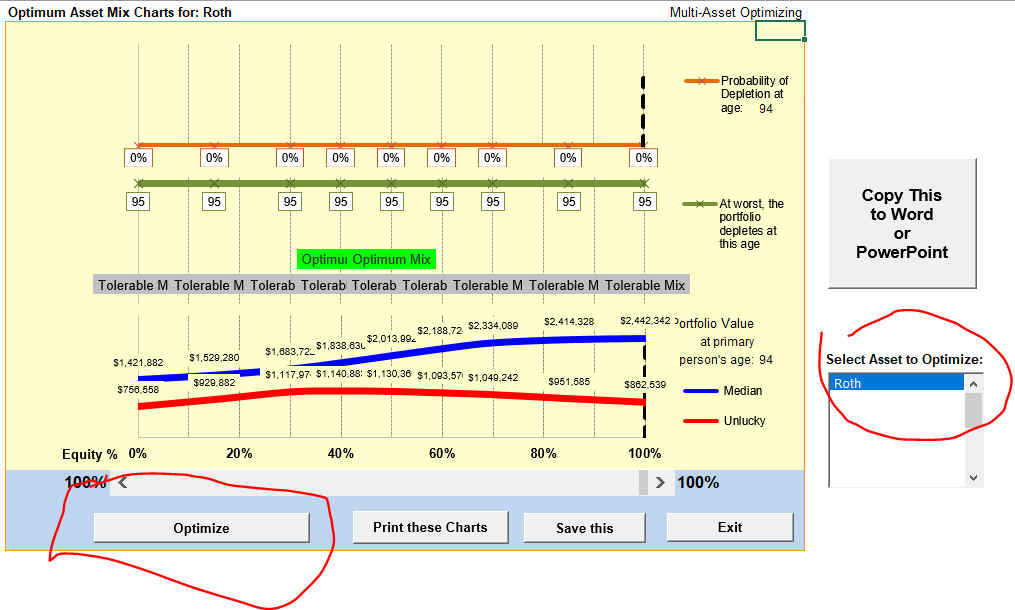
The optimum range is where the green band is displayed, a range from about 32% to 58% equity in the portfolio. This is the optimum for the Unlucky outcome (the red line). If you think you can achieve the median outcome (DALBAR research has some findings about this assumption), then follow the asset mix where the blue line peaks, which happens to be 100% equity.
Why can’t
I “optimize” a portfolio for an 81+ year-old person?
Program keeps saying “not sufficient time horizon available"
Program needs a time horizon of 15 years or more for optimization to
run. Anything shorter, even the most optimum asset allocation will get caught in
short term events.
Just increase the age of death ("design until age") on the "Main" page so that it is at least 15 years higher than the current age. Then it will work.
My equities' return is same as the index. However, my dividends amount to 3%. How do I handle that?
Set alpha to 3%.
My equities' return is same as the index. However, I pay 1.5% management fees. How do I handle that?
Set alpha to -1.5%.
What
if I don't know how my equities perform relative to the index?
Set alpha to 0%.
I have a client with a tight
picture. She wants to buy a
car 2 years before retirement.
If you enter any
withdrawal under “Lump Sum Withdrawals” or “Other Lump Sum Withdrawals”
in the Cash Flow page, then it will take out the money from the portfolio
regardless of client being retired or not. Enter only the amount that she needs
to take out from her portfolio, not necessarily the full car cost. If she is not
taking any money from the portfolio, then don't enter any withdrawals (for this
item) from the portfolio.
I tried to read the user guide to check it out and it says "No program is registered to open this file"
1.
You need to have adobe reader. You can download one from www.adobe.com
for free
2.
You need to make sure to associate the pdf file with the acrobat reader.
You can use your control panel to do that.
"Total University Costs" on the Mortality
tab: At what age of the child, exactly, does ORC apply these costs?
I see in the user's guide that the total cost is divided by 4 and applied
over 4 years. However, when is the first year applied?
It
is applied for the last 4 years of support ages. For example if you have
following input:
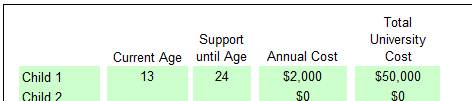
The
amount calculated will be $2,000 for each age 13-23 (inclusive) and $12,500 for
ages 20-23 (inclusive), adjusted for the indexation you entered. "Support
until Age" means no support, for the above example, at age 24.
What are constraints? Why does it complain about constraints every time I run?
Age Constraints: any asset where you have specified that withdrawals are allowed only between ages x and y; i.e. anything other than "start withdrawals a retirement, end them at death" is an age constraint.
Withdrawal Constraints: If you have checked any of the withdrawal limitations or reductions, such as "cut expenses if withdrawal rate exceeds x%" , and/or "cut expenses if growth is less than x%", and/or "limit withdrawals to x% of portfolio growth", and/or "limit withdrawals to x% of portfolio growth" then you have constraints for that asset.
Unless you must (for a research or out of curiosity or bucket strategy), I would leave the constraints out. Just don't use them.
Here is how the program works
with constraints:
1. It runs the aftcast.
2. If the outcome is in the
green zone, no problem: it moves on, shows you the stress test form, etc.
3. But if the outcome is not in the green zone (i.e. gray or red zone), then it checks any constraints for each assets. If it finds any constraint for any asset, it will display the list of assets with these constraints. Here, you select assets that you want to remove the constraints from. Then the aftcast runs again; now free of constraints, in the hopes of turning the outcome to the green zone.
After running the aftcast with
constraints removed, if you save that scenario, then it will save it with
constraints removed. However, if you don't save it, the constraints will load
again when you retrieve that scenario next time.
What
does it base the optimization on? Does it consider the other asset classes
current composition before optimizing?
Optimization for each asset is based on its own cash flow (accumulation/withdrawals) after running the aftcast. It optimizes by minimizing the probability of depletion or maximizing unlucky portfolio value at various asset mixes of that particular asset by running various equity and fixed income percentages. Fixed income are conventional bonds, inflation indexed bonds and cash percentages entered with each asset. It does not look at the entire portfolio and other assets in the asset list, only itself.
Can
you give me a hint about saving a report as a PDF? You indicate it can be done
from the print protocol.
1.
You can make pdf files only if you have a pdfmaker software. First,
set your printer as the pdf maker
Next,
click on the print button, follow
instructions (file name, where to save, etc.). Note that since the page format
of each page is different, the program will ask each page separately. You might
end up with five or six separate pdf files which you can bind together with your
pdfmaker software.
On
the Main page, you had before a place to add annual retirement savings. I don't
see that anymore, what happened to it?
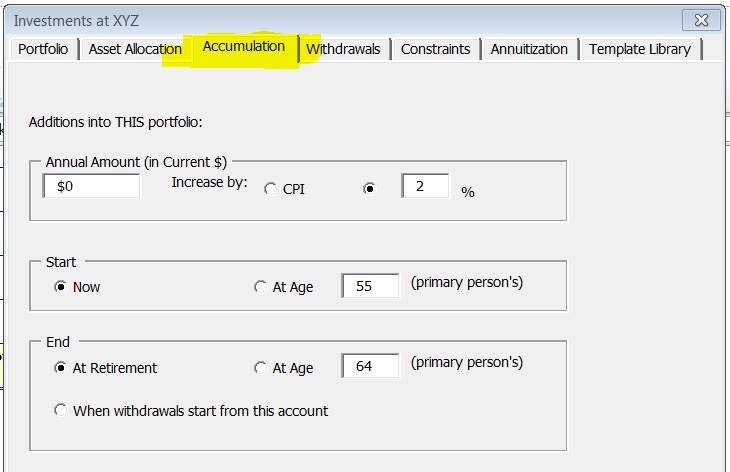
Periodic
savings are now with each asset. Now, you can have different amounts of
deposits/additions with different age ranges and indexation for each asset. Just
click on the “accumulation” tab:
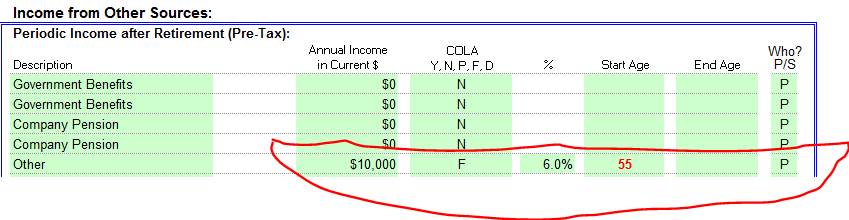
Income prior to retirement: I have a question about the input for an income stream that a client is receiving now and which he will continue to receive in retirement, which will begin 10 years from now. Suppose he will receive $10,000 this year and it will grow at an annual rate of 6% for as long as he lives. I am not clear on what to enter on the Cash Flow screen. I can’t input $10,000 with his current age because the program complains that that value must be after his retirement age. Do I calculate what the income stream in ten years will be worth in today’s dollars, using an inflation-adjusted rate? If inflation is 3%, the inflation-adjusted rate would be 2.91%, so the future income amount would be worth $13,326 in today’s dollars, assuming I have done the math correctly. I am also guessing that I would select Fixed Indexation Rate (F) and enter 6% rate in the next two fields.
Yes, if you enter it in the “Income from
Other Sources” In the Cash Flow page, the program will “complain” a
little. Say the client is currently 55 years old, he is planning to retire at
age 65.
The question you need to ask is this: What is happening to this money over the next 10 years, before retirement? Below, I will show how to enter 4 different scenarios:
Saving all of this money prior to retirement regularly
Saving none of this money prior to retirement
Saving some of this money prior to retirement regularly
Saving some of this money some of the time
A. Saving all of the money prior to retirement regularly:
1.
If this money is saved in one of the assets,
or in the bank account, then go ahead and enter it, ignore the complaint. Here
is what will happen:
Since this money is surplus between ages 55 and 64, it will be deposited to the designated asset (the designated asset is the one with the blue description), or to Bank Account(s)
B. Saving none of this money prior to retirement:
On the other hand, if this money is not
saved but you just want to calculate the future value and start making it
available only at age 65:
Enter it under “Single Premium Annuity....”
This will be calculated as following:
C. Saving some of this money between now and retirement:
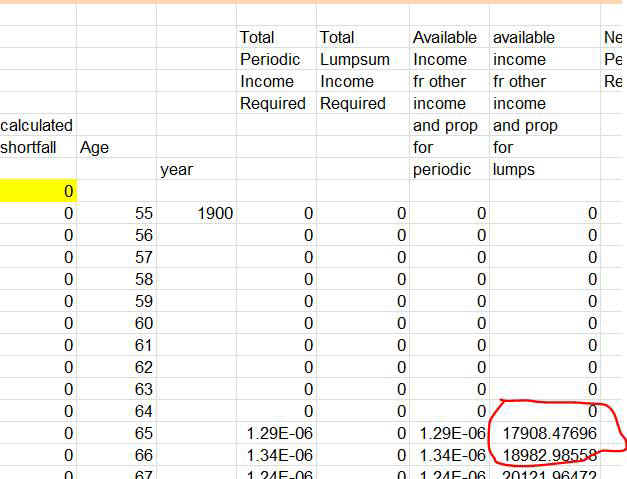
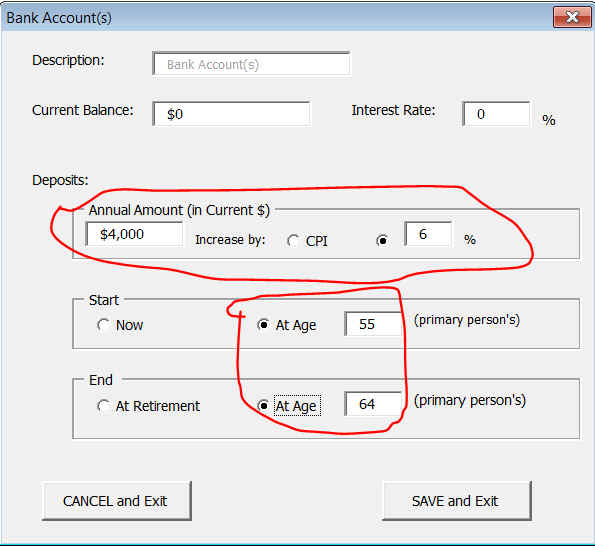
Say, your client will save $4,000 of this money (indexed by 6%) between now and retirement in his bank account.
Enter everything as described in section (B). Then enter it as savings in the account of your choosing:
D. Saving some of the money some of the time prior to retirement:
Say you client wants to save $4,000, $5,000, $7,000, $10,000 at ages 57, 58, 59, 62 respectively.
Enter everything as described in section (B). Then enter it as savings in the cash flow sheet:
One
thing I think may not be good for the plan is to start the MRD withdrawals
before age 70 (like at retirement at age 63), and at amounts greater than the
legal limits, because of increased taxation, even if this changes the outcome
from Adequate to Excellent. Do you have any thoughts on this one item
about the feasibility of improving results at the expense of taxation for my
client?
I can't seem to modify my Benchmark credit…screenshot attached.
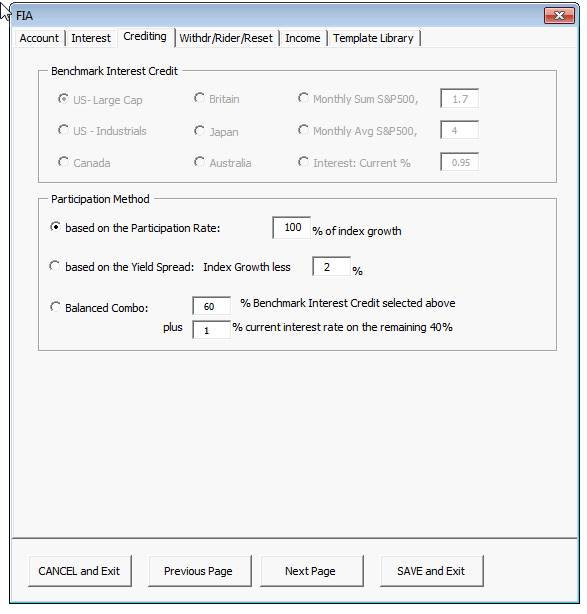
It
looks like you are buying this FIA using money from an existing investment. In
such cases, you won’t have any choice in the benchmark for interest
crediting, to program will use the same asset as was used in the investment.
Thus, choices are inaccessible.
If
you want to have a choice of benchmark interest asset choices, you need to
indicate on the first page of FIA assets that you are buying this FIA from
External assets, or you already have this FIA. Only then, the program will give
you choice of benchmark indices.
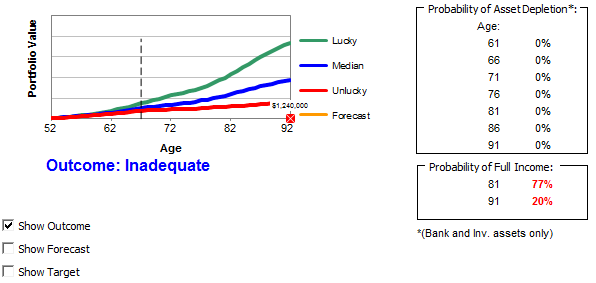
This
makes no sense: It says that the probability of asset depletion is 0%, but that
the probability of full income at age 84 is 86%, and at age 94, 36%
The inputs you entered have several restrictions, which leaves the client asset rich and cash poor. Here are my suggestions:
1.
1. Check
the box “allow as much as withdrawals as required...” . Otherwise, the
program withdraws ONLY the minimum, regardless of how much income is required:
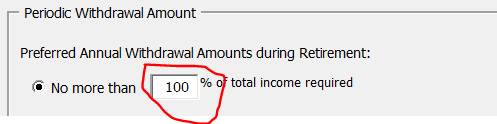
1. 2. Enter preferred withdrawal amount 100% where possible That will ensure that required income is withdrawn fully in the order of assets, instead of partial:
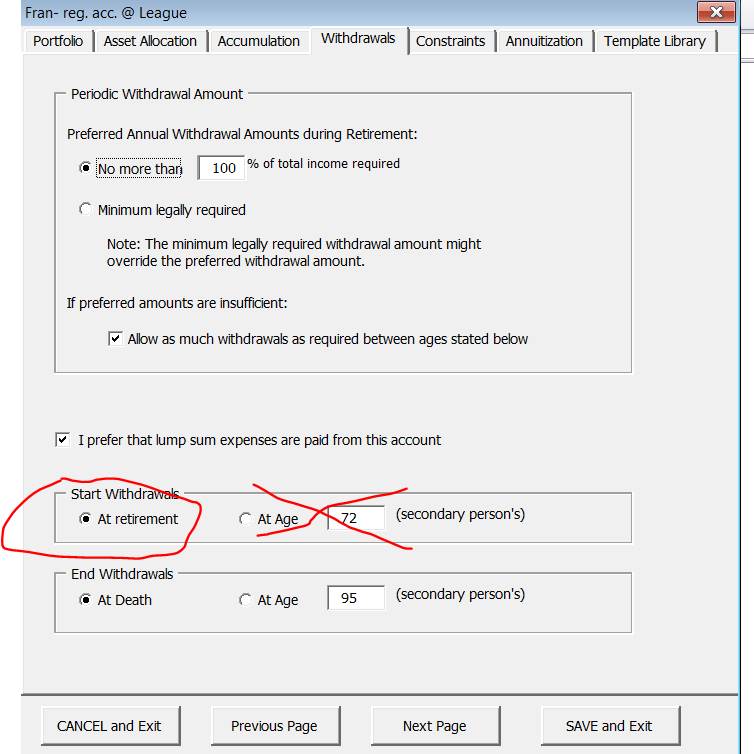
1.
3.
Where
possible, do not enter specific ages for withdrawals, click on “start
withdrawals at retirement” and “stop at death”:
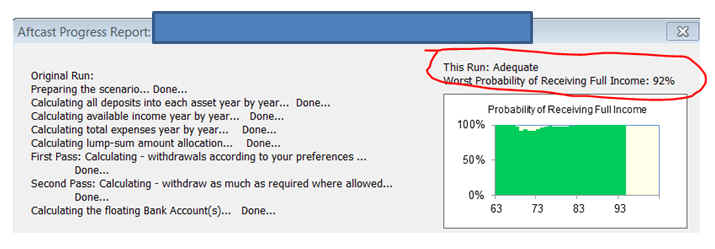
When I ran your scenario with these changes, the outcome was "Excellent"
What
does this mean? I didn't think I did anything special.
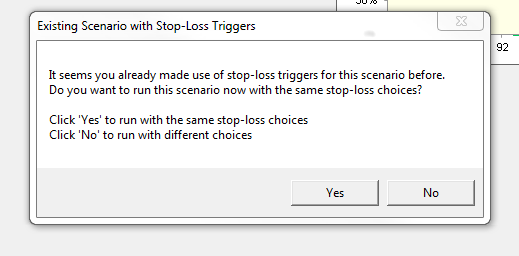
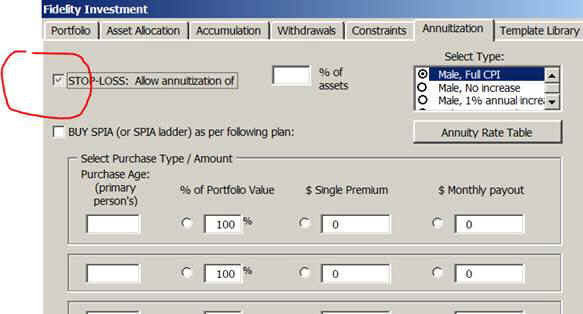
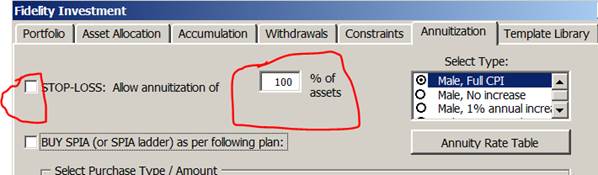
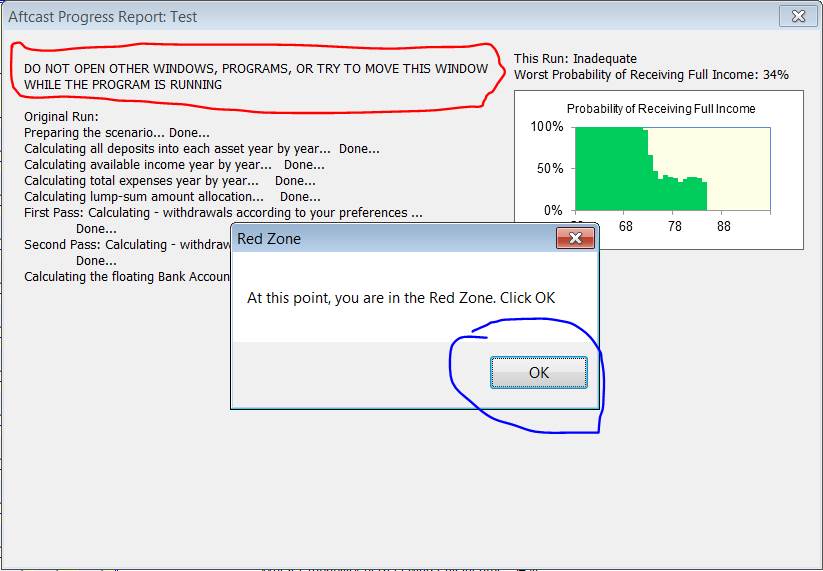
If you have a previously saved scenario with stop-loss triggers (stop-loss annuity or stop-loss sale of existing home or stop-loss of sale of existing property), when you retrieve and rerun it, the program will first run without any of these stop-loss triggers. If the result is not “Excellent”, then the program asks you if you want to rerun the case with these SAME stop-loss triggers as you had before, or if you want to change them. I would normally click “No” to see and/or modify these stop-loss triggers.
It
appears to me that each asset goes through optimization separately and that
after it is complete that the originally input AA is retained.
Does
each optimization assume all other assets maintain their original AA?
Should user update the data in the asset 1 before optimizing the second
asset? If not, then is not the
second optimization based on a wrong assumption of Asset 1 that has not been
updated.....and if you do update Asset 1 and then if there is follow through
successive optimizations of other investment accounts, is the Asset 1
optimization still valid or would a new optimization of Asset 1 yield a
different result.
I'm
stuck in a circle...how do I get out?
The optimization should be run after running a scenario because the optimization uses the cash flow for each asset for that particular scenario.
Optimization is run for each investment asset
separately. Once you optimize for an asset, change the asset mix to optimum
using the slider, then click on “save this” to save it and then move on to
the next asset.
Once all assets are optimized, you might want to rerun the scenario to see if there is any improvement in the outcome. Once you rerun it with optimized assets, do you do optimize again? You can, but in most cases it makes little or no difference after the first optimization. For example, if the average income on the Chart3 page goes from 83% to 85%, it is only a statistical event, in real life it is an insignificant “improvement”.
Does
optimization take into consideration of account restrictions.
For example, if there is a
tax-sheltered account and an
open account - does the software
optimize knowing that all income needs will come from the
open account until which time the
RRSP converts?
First Pass for tax sheltered assets: The minimum legally required amount is withdrawn first, larger if you checked for example, "I prefer to take no more than 50% of total withdrawals from this asset". If there is an income shortfall, then it will be withdrawn from the open investment asset next. Second Pass: If there is still a shortfall and you have also checked "Allow as much withdrawal as required between the ages stated below" for any asset, then the program will run a second pass for these assets, looking for more money to cover the shortfall, in the exact order on the asset list.
First Pass for open investment assets: The program will still take the minimum legally required amount from the tax-sheltered account first. After that, it will take any shortfall from the open investment account according to your preferences, for example, "I prefer to take no more than 50% of total withdrawals from this asset".
Second Pass: If there is still a shortfall and you have also checked "Allow as much withdrawal as required between the ages stated below" for any asset, then the program will run a second pass for these assets, looking for more money to cover the shortfall, in the same order as on the asset list.
In short, during the first pass, the program withdraws first from tax-sheltered accounts, then from open investment accounts, complying with minimum legal withdrawals and/or any asset specific preferences/constraints that you enter. If there is a shortfall, the program runs the second pass in the same order as assets designated "Allow as much withdrawal as required between the ages stated below".
Finally, the asset where the surplus is added to (the asset with the blue description), is run last to sweep-in any surplus or additional money. After that, the program then runs the Bank Account(s) asset to take care of any shortfall and/or surplus where possible. Depending on the outcome (green or red zone), the cycle repeats until a solution is found using different stop-losses, removal of any constraints, changing input data, or running a stress test.
Now the sequence of withdrawals is covered, let's answer the question "Does optimization take into consideration of account restrictions?" Answer: Yes, once the program finishes running a scenario and you are satisfied with the outcome, you can then run optimization (of the asset mix) for each investment asset with its own cash flow and all its constraints.
Is there a
way to downsize a home at a certain age, regardless of being in the red or green
zone? The Home entry in Assets seems to only offer you immediate
downsizing (at the current age) and only if retirement assets are insufficient.
Sure. Here is how you can
easiest enter downsizing at a future age, regardless of the zone.
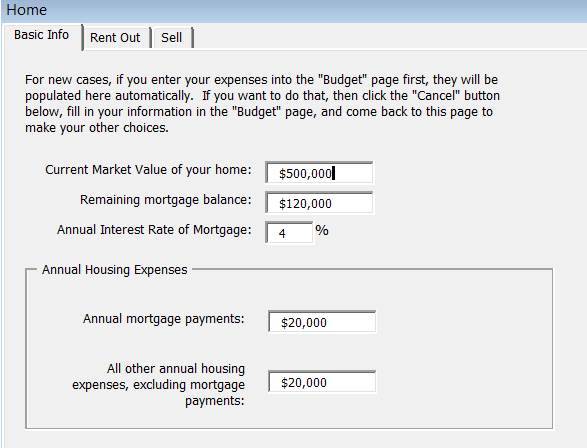
Say, this is the information
about your current home: Your current home is valued at $500,000 and your
current housing expenses are $20,000/year and the mortgage payments are
$20,000/year:
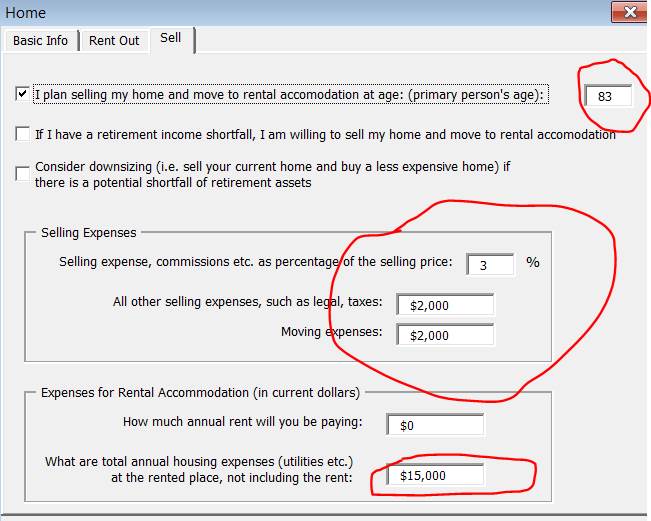
Say you want to downsize at age 83, the downsized home is $300,000 in current dollars. You expect your housing expenses $15,000 after downsizing in current dollars.
Click on the “Sell” tab.
Pretend you are selling your home at age 83 and moving to a rental
accommodation, even though you are downsizing and moving to a less expensive
home. Uncheck the "Consider downsizing" box, because you don't want
the program to decide for it anymore. Enter $0 for rental costs:
When you run the scenario ("Run Plan") then at age 83, the proceeds of the sale of the home will be added to assets. This amount is net of selling/moving/legal expenses and after paying off any remaining mortgage balance.
The next step is entering the amount that you need to withdraw from your assets to buy the downsized home, in current dollars. The value of the downsized home is increased (or decreased, if deflation) by the amount of the CPI each year. Here is the trick: The only place to enter a one-time expense that is indexed to CPI is on the Cash Flow page, is under "Income from Other Sources" area. Because this is an expense and not income, we enter this amount with a negative sign. Choose CPI floor as "Z", because the home price might go up or down with CPI.
The program only needs to know how much you need from your assets to buy this downsized home. As far as the program knows, you sold your hone at age 83 and that is it. For example if you need a mortgage when buying this downsized home, then you would enter the cost of purchasing this downsized home excluding the mortgage amount. For example if you take a mortgage of $100,000 when buying this downsized home, then you would enter the purchase cost as $200,000 and not $300,000 because you take only $200,000 from your own assets. Furthermore, if you are planning to run the life insurance requirements, don't forget to add this $100,000 mortgage amount to your liabilities in the "Mort" page to calculate the life insurance needs properly. That is because, as far as the program knows, when the original home was sold, the mortgage was paid off and no mortgage was left to enter as liability on the insurance page.
Make
sure to enter this line with start and end ages the same, "83".
Here is how this looks on the Table2 page. The yellow highlighted numbers indicate how the periodic income required is reduced due to the downsizing at age 83:
Using the same procedure, you can have more than one downsize during your retirement.
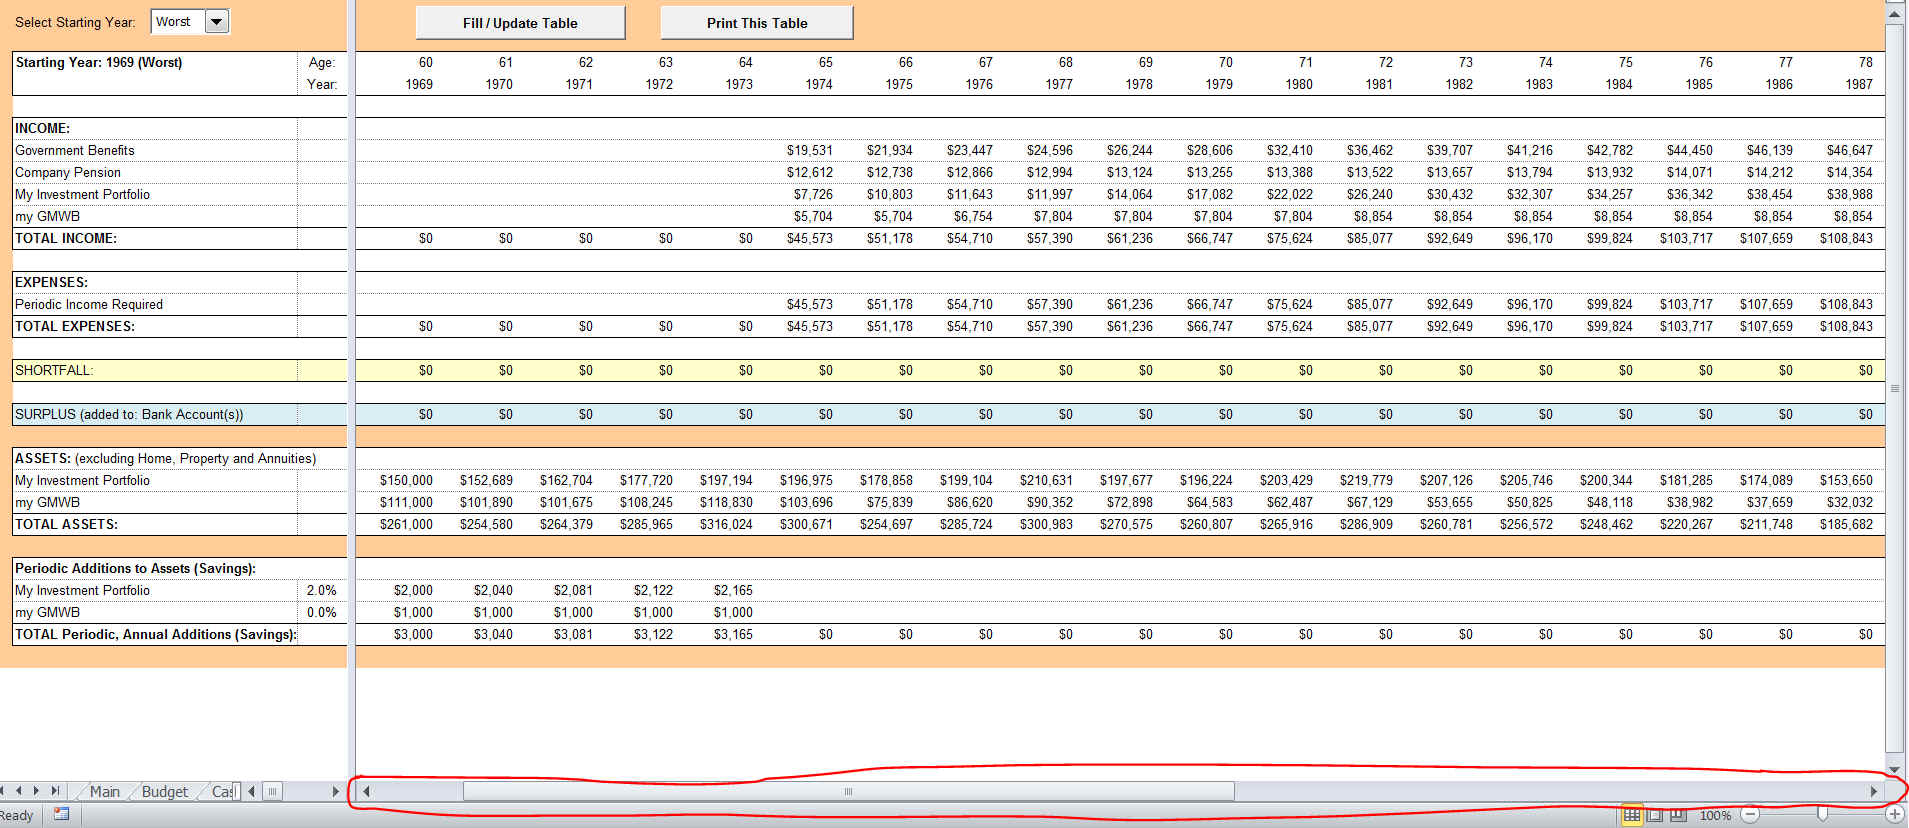
How do I freeze the column with the row headings in Tables2 (Income and Expense items) so when I scroll through the years that column stays visible?
This is how the Tables2 page looks like normally:
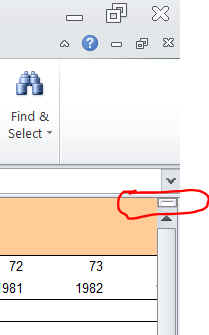
1. Move mouse on top of the vertical scroll divider, which is on the bottom right of the Excel, next to the horizontal scroll bar area:
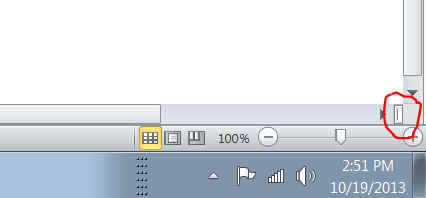
when the cursor is exactly on top of this divider, the pointer looks like this:
Just click on the left mouse button and drag the vertical line to the left. Stop where ever you want. Now you have a separate scrolling columns. Click on arrows or drag the scroll bar to move the visible columns left and right.
You can also do the same for rows by using the horizontal scroll divider. It is on the right, top of the of the vertical scroll bar:

I entered stuff on the blank page. After I close the program and restart, it all disappeared. Why?
If you want to save your input on the blank page permanently (each time you open the ORC, for all scenarios):
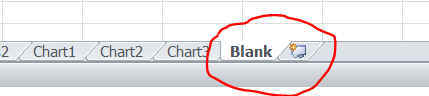
click on the "Save" button on that page
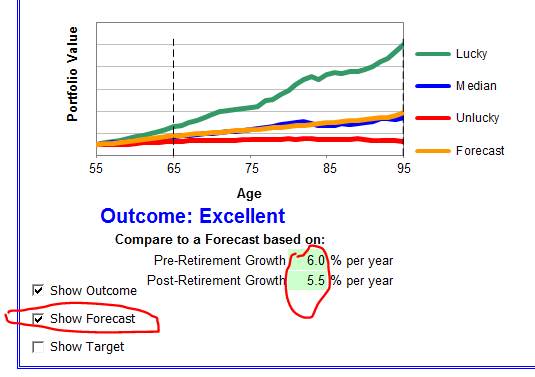
I am wondering if there's an easy way to get the average implicit rate of return for the various scenarios i.e. lucky, unlucky, median?
Yes. On the Main page, check the box “Show Forecast”. Vary the growth rates until the orange line overlaps the median line. That is your implicit growth rate for a median portfolio. Same process for unlucky and lucky.
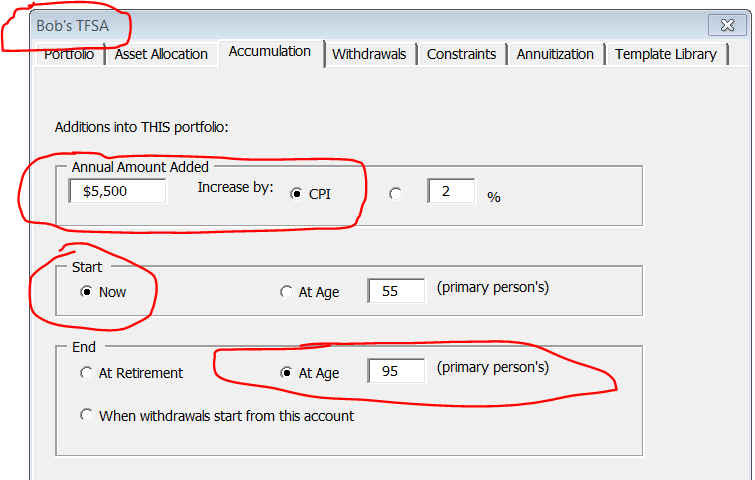
I am planning to add the maximum contribution amount (currently $5,500, indexed to CPI) to my Tax Free Savings Account (TFSA) for the rest of my life. I am currently 55 years old, plan to retire at age 65. Until retirement, this money comes from my earnings at work. But after retirement, it will come from income from other sources, or my other retirement savings, or my other investment accounts. How do I enter that?
1. Enter the TFSA asset as you normally would. Then enter accumulation info as shown below:
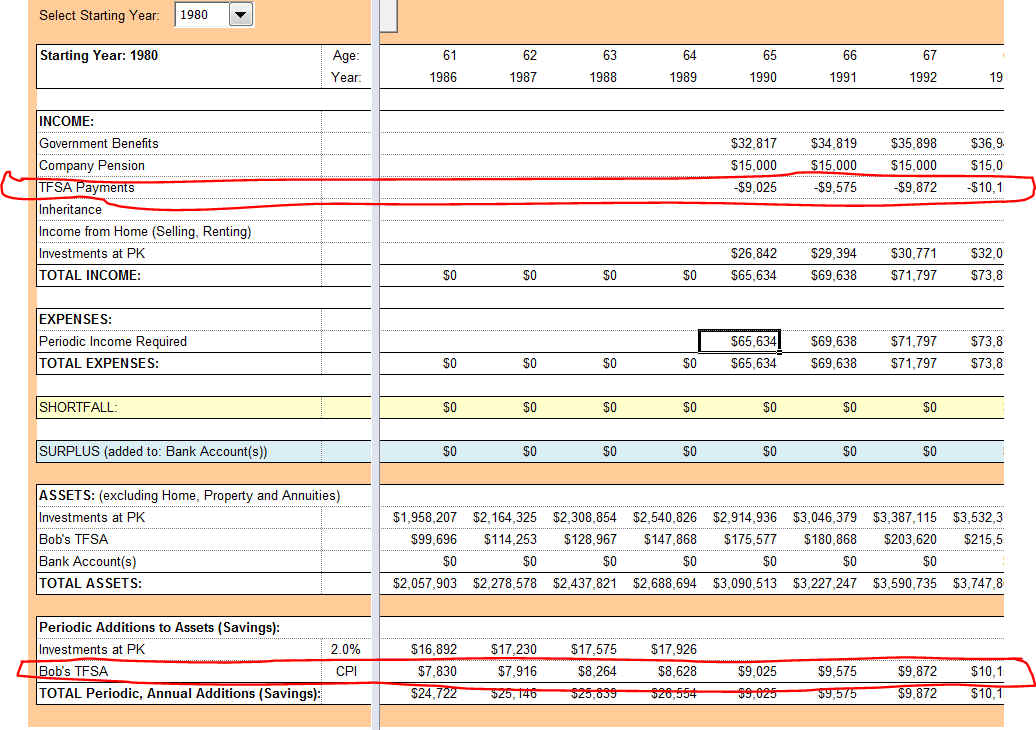
2. Now, we need to enter the source of this money after retirement. The amount is indexed to CPI. The only place to enter anything indexed to CPI is in the Cash Flow page, under the "Income from Other Sources" area. This money will first taken out from other income, if this is not sufficient it will be taken out from assets. Because this is an expense and not an income, you need to enter this with a negative sign as shown below:
On Table2, we see that the TFSA asset is accumulating for all ages. However, only after age 65, the money comes from other income sources and, if necessary, from own assets:
If the annual accumulation amount was indexed by a fixed amount, say 1% or 2%, then you could enter it Lump-Sum Withdrawals on the Cash Flow page, like this:
When entering TFSA assets on the "Assets" page, make sure to place this TFSA line below all other assets on the asset list, so that this accumulation can continue as long as possible, money to be taken from other assets and added to TFSA.
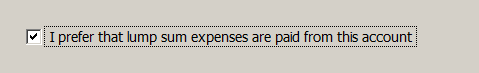
I believe there is something wrong with the software. I have a balance in an IRA and it is showing tuition fees and other expenses that I entered on the Cash Flow page coming out of the IRA in his 50s. I have it checked where no income is supposed to be paid out until retirement which is age 65. I want this money come out of the Bank Account, not from any other asset.
Here is what you have entered:
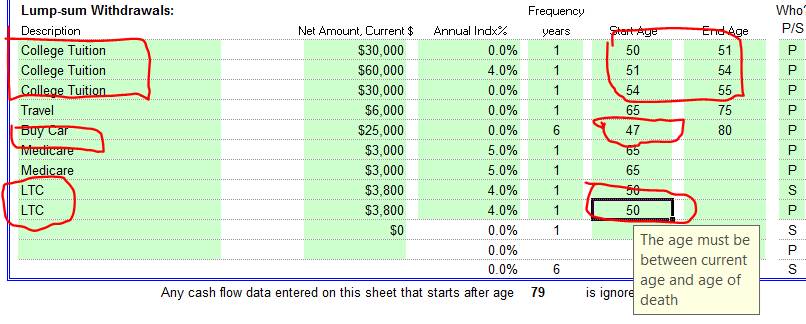
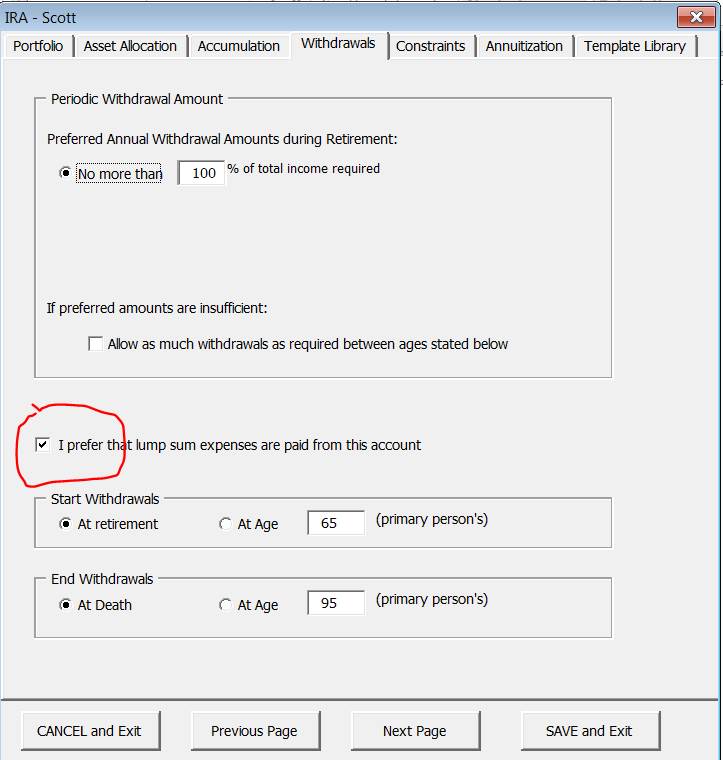
If you don't want expenses coming out of this asset, then uncheck as shown:
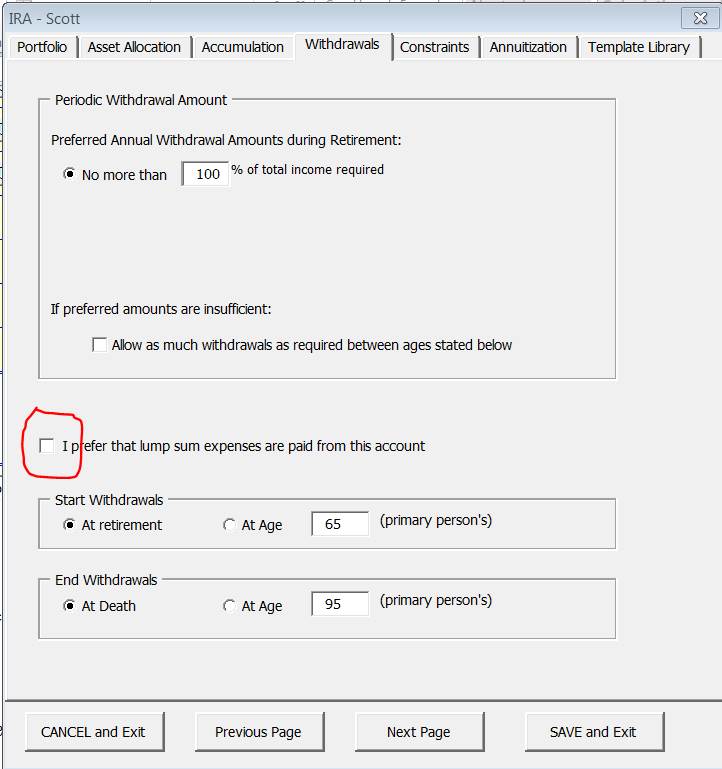
Also, do the same (i.e. uncheck) for all assets. Then the money will be forced to come out of the Bank Account.
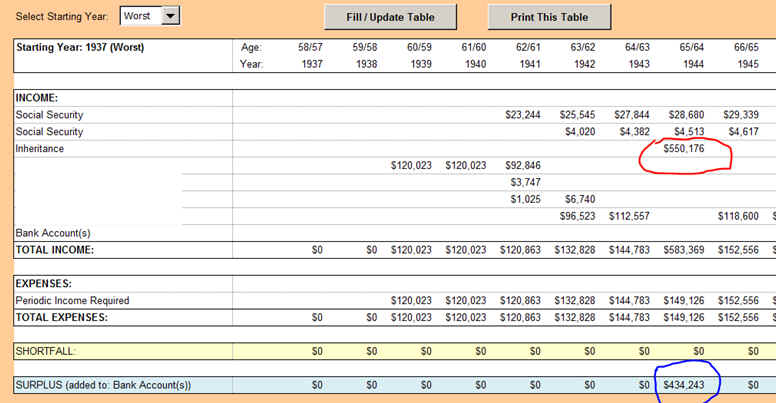
I have a problem. My client is 58 years old. Assume that he will inherit money from his mother in seven years when he is 65. The current value of the inheritance today is $391,000.00. Using my HP12-C and assuming a 5% return for seven years with $0 payments the future value at age 65 should be $550,176. Why does ORC2019 calculate the future value to be $434,243.00 on the Chart1 page?
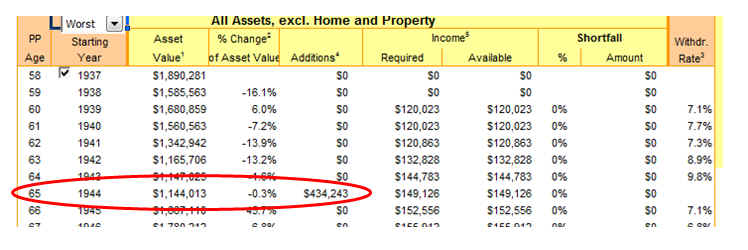
You might be misinterpreting the
information on Chart1:
1. Take
a look at Table2. The red circled number is the FV of the inheritance money:
$550,176, which is exactly what you have calculated.
2. In
the Chart1 page you are looking at additions, which shows $434,243. That money
is the net amount added to assets; it includes not only the FV of inheritance,
but all other incomes (totaling $583,369) less the expenses ($149,126).
Chart1 data is the summary of each year,
whereas Table2 will give you all details of
given year.
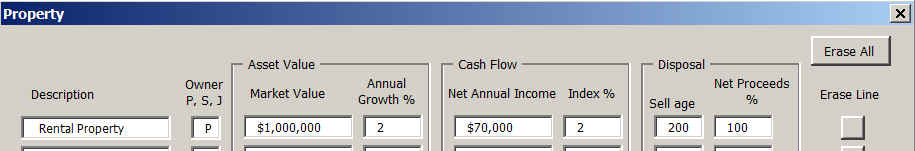
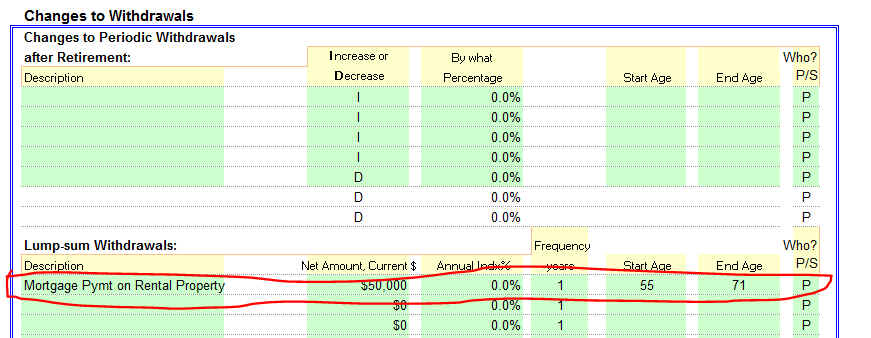
I understand that when you have a mortgage on your home, the program automatically handles that. I have investment properties worth $1,000,000 and I collect -after paying other expenses but before paying mortgage- $70,000 /year. From that I pay $50,000/year for mortgage payments on that property until age 71. How do I enter that into the program?
Enter the property information on the assets page under "Property":
Enter Mortgage Payments in the Cash Flow Page as expenses:
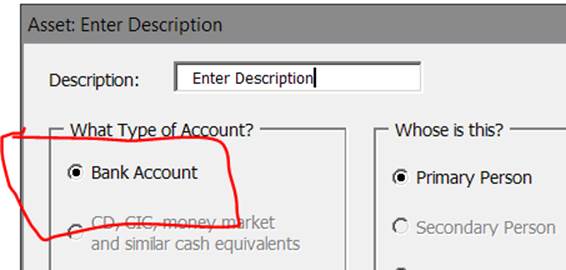
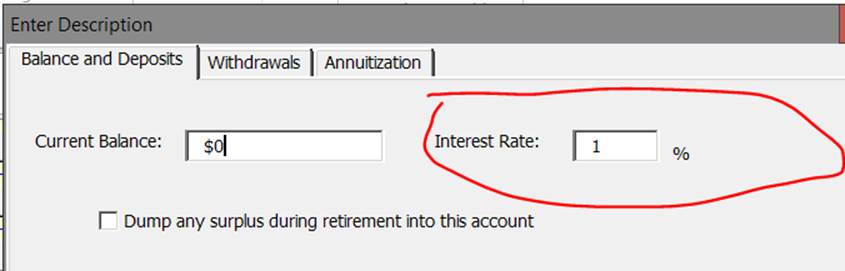
The amounts for money market, savings, and CD in Table2, increase by much more than the current rate being paid. Why?
The program uses the historical data for each year. If you don't like that, use the "Bank Account" as your type of account. This will allow you to enter the interest rate you like to use.
.